Diagnosing Battery Sag in ArduPilot Flight Logs
Key Takeaway
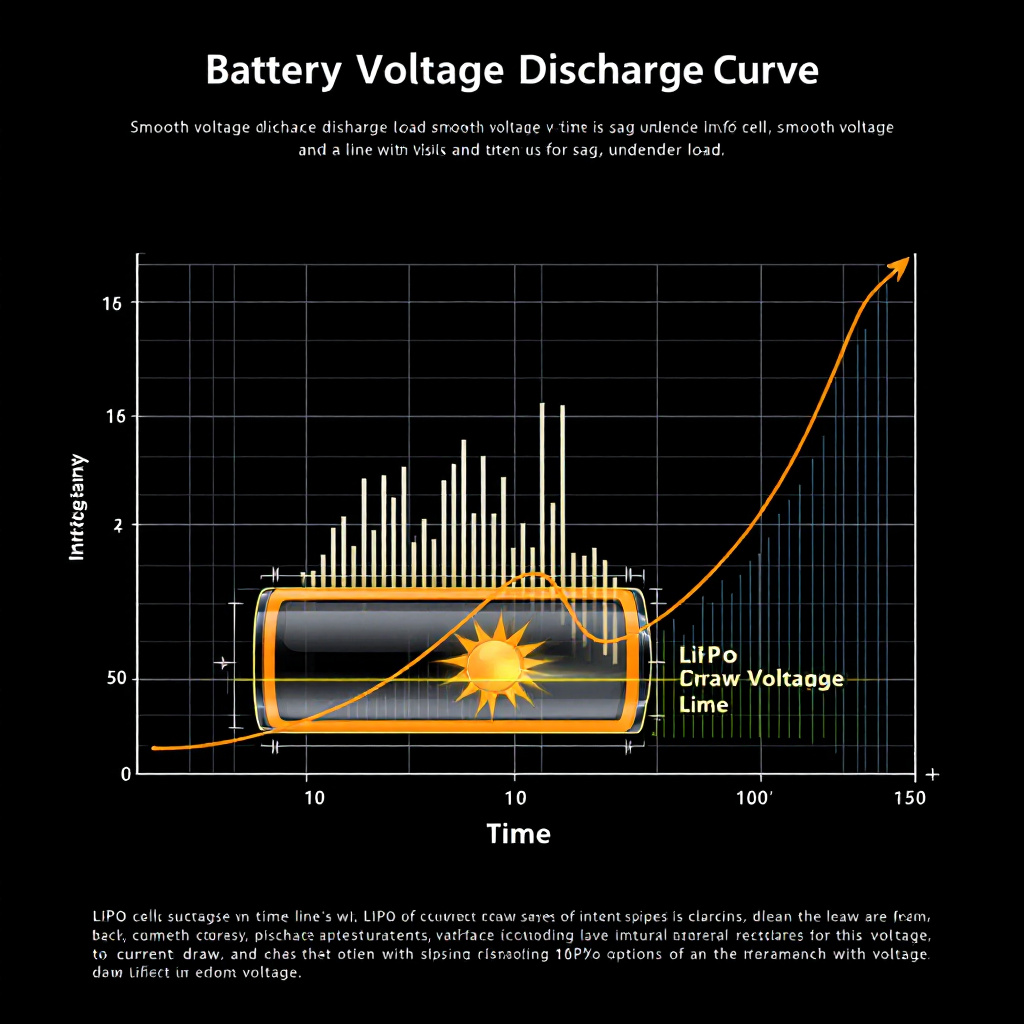
Battery sag in ArduPilot is the gap between BAT.Volt (measured under load) and BAT.VoltR (resting estimate). Per-cell sag thresholds: under 0.05 V/cell excellent, 0.15-0.30 V/cell aging, over 0.30 V/cell approaching end of life. BAT.Res trend across flights signals aging packs before they cause failsafes.
TL;DR: Battery sag in ArduPilot logs is the gap between BAT.Volt (measured voltage under load) and BAT.VoltR (resting voltage estimate). A small gap during high-current segments is normal; a large gap that doesn’t recover when you reduce throttle indicates worn cells or an oversized current draw. Calculate per-cell sag by dividing the gap by BATT_VOLT_NUM_CELLS — under 0.1 V per cell per amp drawn is healthy; over 0.3 V per cell signals an aging pack on the way out.
What "sag" actually means in lithium chemistry
A lithium-polymer cell’s terminal voltage drops below its open-circuit voltage when it’s delivering current. The drop is proportional to the cell’s internal resistance times the current. A fresh pack with healthy cells has low internal resistance (5–15 mΩ per cell typical) and small sag; a worn pack has higher resistance and larger sag for the same draw.
ArduPilot’s battery monitor computes the resting voltage in real time using a model of cell impedance — effectively asking "what voltage would this pack read if no current were flowing?" BAT.VoltR is that estimate; BAT.Volt is what the ADC actually measures.
The fields that matter
BAT TimeUS Inst Volt VoltR Curr CurrTot EnrgTot Temp Res RemPct H SHVolt— measured voltage under current load.VoltR— resting voltage estimate.Curr— current in amps.Res— estimated whole-pack internal resistance in ohms. Rising means aging cells.RemPct— remaining capacity percentage. Computed fromCurrTotagainstBATT_CAPACITY.Temp— pack temperature, where available, scaled by 100 (e.g. 23.4°C is logged as 2340).SH— state-of-health percentage. 0 if not estimable.
Reading sag in Mission Planner
Plot BAT.Volt, BAT.VoltR, and BAT.Curr on one chart:
- The
Volttrace dips belowVoltRwhen current rises. The gap is sag. - During hover at constant current, the gap should be steady. Step changes in current produce step changes in sag.
- If
Voltrecovers to within ~0.1 V ofVoltRwhen throttle drops, the pack is fundamentally healthy. IfVoltstays well belowVoltRfor extended periods, the cells are worn or the current model is wrong.
Per-cell math — the rule of thumb
Divide the gap (VoltR − Volt) by the cell count to get per-cell sag. Per-cell sag thresholds at the current draw at the time of measurement:
- Under 0.05 V per cell at low current — excellent. Fresh pack or well-sized for the load.
- 0.05–0.15 V per cell during sustained current — normal for healthy packs in the middle of their life.
- 0.15–0.30 V per cell at design current — pack is aging; capacity will already be reduced from new.
- Over 0.30 V per cell — pack is approaching the end of safe life; expect failsafe trips and reduced peak performance. Replace soon.
These thresholds are normalised against the current draw. A 6S pack reading 0.5 V of sag at 50 A is similar per-cell health to one reading 0.25 V at 25 A — both are around 0.08 V/cell normalised.
Sag versus depletion
Two related but different failure modes:
- Transient sag — voltage drops momentarily under high current and recovers when throttle reduces. The pack still has capacity; you just hit its current-delivery limit. Fix is more pack (parallel cells, higher C-rating) or a less demanding flight envelope.
- Depletion — both
VoltandVoltRdrop together as the flight progresses. The pack is genuinely running out of energy; this is normal at the end of a flight and is what failsafe is for.
The diagnosis matters because the fixes differ: transient sag needs a better-rated pack; depletion needs longer flight time, smaller missions, or a less demanding payload.
Pack resistance as a fleet maintenance signal
BAT.Res trends across flights tell you which packs are aging:
- Capture
BAT.Resfrom steady-hover segments (not transients). - For a fresh 6S 22000 mAh pack, expect whole-pack resistance around 15–30 mΩ.
- Twenty percent above the new value is a warning; fifty percent above is replacement territory.
- The trend matters more than the absolute number — different chemistries and current sensors give slightly different estimates.
For an operator with fleet logs, plotting BAT.Res as a per-pack time series identifies aging packs before they cause an in-flight failsafe.
Confirming it in MAVExplorer
MAV> graph BAT.Volt BAT.VoltR BAT.Curr
MAV> graph BAT.Res
MAV> param show BATT_VOLT_NUM_CELLS BATT_CAPACITY BATT_LOW_VOLT BATT_LOW_TIMER
The parameter dump tells you what thresholds the autopilot was configured to react at. If failsafe fired at a voltage you didn’t expect, the parameter snapshot is the first thing to verify.
Fixing the underlying problem
- Use a higher C-rated pack if sag is high but cells are fresh. The pack’s peak current delivery limits the autopilot’s authority.
- Replace aging packs if
BAT.Reshas climbed significantly across a few months of use. - Tune failsafes for the worst-case sag.
BATT_LOW_VOLTshould be set against the pack’s sag profile, not its resting voltage. A pack that sags 0.5 V at peak current needs failsafe thresholds that account for the dip. - Reduce peak current draw — flatter throttle envelope, lighter payload, smoother manoeuvre patterns. The autopilot’s rate-loop tuning influences peak motor current; an over-tuned rate loop produces unnecessary sag.
- Check sensor calibration. If
BAT.Currreports significantly different values than a clip-on ammeter, the current sensor is mis-calibrated and the sag calculations are wrong.
When this isn’t actually a sag problem
- Power module fault. If
BAT.Voltdrops sharply but the airframe is still performing normally, the measurement might be wrong — checkPOWR.Vccand see our power module post. - Connector corrosion. Intermittent voltage drops at random times that don’t correlate with current draw point at a loose XT60 or worn bullet connectors, not a pack problem.
- Cold weather. Lithium cells deliver less current at low temperatures and read lower voltages. Warm packs to 15°C+ before flight in cold conditions.
When LogHat helps — and when it doesn’t
LogHat plots BAT.Volt versus BAT.VoltR with the per-cell sag computed, and trends BAT.Res across consecutive flights of the same airframe so a degrading pack is visible before it triggers failsafe. What we can’t do is tell you which pack of the three you charged this morning was actually loaded on the drone — that needs an operator-side pack-tracking process.
About the author
LogHat Engineering Team
The LogHat engineering team — drone-systems engineers who build and operate the LogHat flight analytics platform. Posts in this byline are written and reviewed by team members working on the parsers, analysis engine, and Vector AI that the post describes.
Tagged
Try LogHat
Analyze your flight logs in seconds
Upload a .bin, .tlog, .log, or .ulg file. Get AI crash analysis, 3D replay, and forensic PDF reports instantly.
Try LogHat Free